Many companies think that the problem is selling more.
In reality, the real limit is often another: not knowing exactly what is happening within the commercial process and what might happen in the coming months.
This means making important decisions based on gut feelings, perceptions, sales optimism, or outdated data.
An entrepreneur can have experience, intuition and knowledge of the market.
But when the company grows, intuition alone is no longer enough.
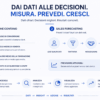
To decide whether to hire, invest, purchase equipment, open a new office, increase your marketing budget, or revise your prices, you need data.
Clear data.
Updated data.
Readable data.
Data linked to the results.
The problem is not having too little data.
The problem is not turning them into decisions.
This is why today sales forecasts and KPIs should not be seen as tools for large companies.
They must become part of the way even an SME manages growth, margins, negotiations and opportunities.
When instinct is no longer enough
There is a stage in which the entrepreneur manages to check almost everything by heart.
He knows his customers.
He knows what negotiations are open.
He understands by feeling which periods will be the strongest.
He trusts the experience of the salespeople.
Look at the turnover at the end of the month and make decisions.
It may work at first.
Then the company grows.
Customers are increasing.
Estimates are increasing.
Acquisition channels are increasing.
The number of salespeople involved is increasing.
Costs are increasing.
The variables to control are increasing.
And at that point the sensation-based method begins to become fragile.
Because one thing is to intuit.
Another is to predict.
It’s one thing to “feel” that a negotiation will go well.
Another is knowing how many deals are truly at an advanced stage, how much they're worth, how likely they are to close, and what impact they'll have on revenue in the coming months.
Second Forrester Predictions 2026, the margin for error for companies is decreasing: volatility, tighter budgets and pressure to deliver results make it necessary to move from experimentation to the generation of measurable value.
This also applies to SMEs.
In a faster-paced and more volatile market, making decisions without data isn't prudent. It's risky.
The problem: Navigating by sight creates an illusion of control
Many companies think they are in control because they control past revenue.
They look at the balance sheet.
They look at the current account.
They look at how much was sold the previous month.
They look at the quotes sent.
They ask the salespeople “how are the negotiations going?”.
But this data is often not enough.
Past revenue tells you where you've been.
It doesn't say where you're going.
Your checking account balance tells you how much cash you have today.
It doesn't say whether you'll have enough margin to sustain new investments in three months.
The number of quotes sent indicates how many offers were produced.
It doesn't say how likely they are to close.
The salesman's opinion is useful.
But if it is not connected to objective data, it remains a perception.
Historical turnover is a snapshot of the past.
Sales forecasts help you manage the future.
Without a KPI and forecasting system, the company risks noticing problems too late.
When sales slow down.
When marginality falls.
When a product line doesn't deliver.
When salespeople are under target.
When marketing generates leads that don't turn into deals.
When the warehouse is oversized.
When liquidity starts to run out.
The point is not to control everything.
The point is to first see what can impact decisions.
The illusion of turnover: selling more doesn't always mean growth.
One of the most common mistakes is to look only at turnover.
Turnover is important.
But alone it can be misleading.
A company can sell more and earn less.
It can increase customers and reduce margins.
It can generate many deals and close few.
It may have a lot of work, but little profitability.
It can acquire new customers at too high a cost.
It can grow in a disorderly way and create more problems than results.
This is why KPIs are useful for measuring the quality of growth, not just the quantity.
A single piece of data says little.
Value arises when data is connected.
For example:
- how many leads become deals;
- how many deals become customers;
- how long does it take to close a sale;
- how much does it cost to acquire a customer;
- how much is a deal worth on average;
- which salespeople convert best;
- which channels bring in the most profitable customers;
- which products generate the most margin;
- which offers get blocked most often;
- what are the reasons for losing sales.
It's not enough to know how much you sell.
You need to understand how, where and at what margin you are selling.
The new vision: moving from opinions to data
Data-driven management does not eliminate the entrepreneur's experience.
It makes her stronger.
Intuition remains important.
But it must be supported by a clear numerical basis.
Data is no substitute for vision.
They serve to protect her.
Because when a decision is made only on gut feeling, the risk is high.
However, when it is based on updated data, clear KPIs and realistic forecasts, it becomes more solid.
The question is not:
“How do we think it will go?”
The question becomes:
“What does the data tell us?”
This shift in perspective transforms the way the company thinks.
You don't just work to make ends meet.
A vision for the coming months is built.
It's not just the final result that you control.
We observe the steps that generate it.
Problems are not discovered when they are already evident.
Weak signals are identified first.
A data-driven company doesn't make decisions after the problem has exploded.
Decide while the problem is still manageable.
What are KPIs and why do they really matter?
KPIs, Key Performance Indicators, are key performance indicators.
But not all data is KPI.
A KPI is only useful if it helps you understand whether a process is going in the right direction.
For an SME, there shouldn't be too many KPIs.
They must be the right ones.
They should help answer concrete questions:
- are we generating real opportunities?
- Do quotes turn into customers?
- is the sales cycle too long?
- Are salespeople working on the right deals?
- Is marketing bringing in qualified leads?
- Is the margin under control?
- Is the pipeline sufficient for the next few months?
- What areas need attention?
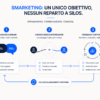
The risk, in fact, is measuring everything and understanding nothing.
A dashboard full of numbers isn't automatically useful.
It is useful when it shows a few important, readable, and decision-related data.
Oracle, speaking about sales planning, focuses on the need to create more accurate forecasts, plan quotas, simulate scenarios and collaborate through data-driven tools and predictive analytics.
The point is clear.
KPIs are not for filling reports.
They help you make better decisions.
The business KPIs that an SME should monitor
Each company has different characteristics.
But there are some fundamental KPIs that almost always help to understand the health of the commercial process.
| KPIs | What does it measure? | Why it's important |
|---|---|---|
| Leads generated | Number of contacts acquired | Helps understand the input volume |
| Qualified leads | Really interesting contacts | Measure quality, not just quantity |
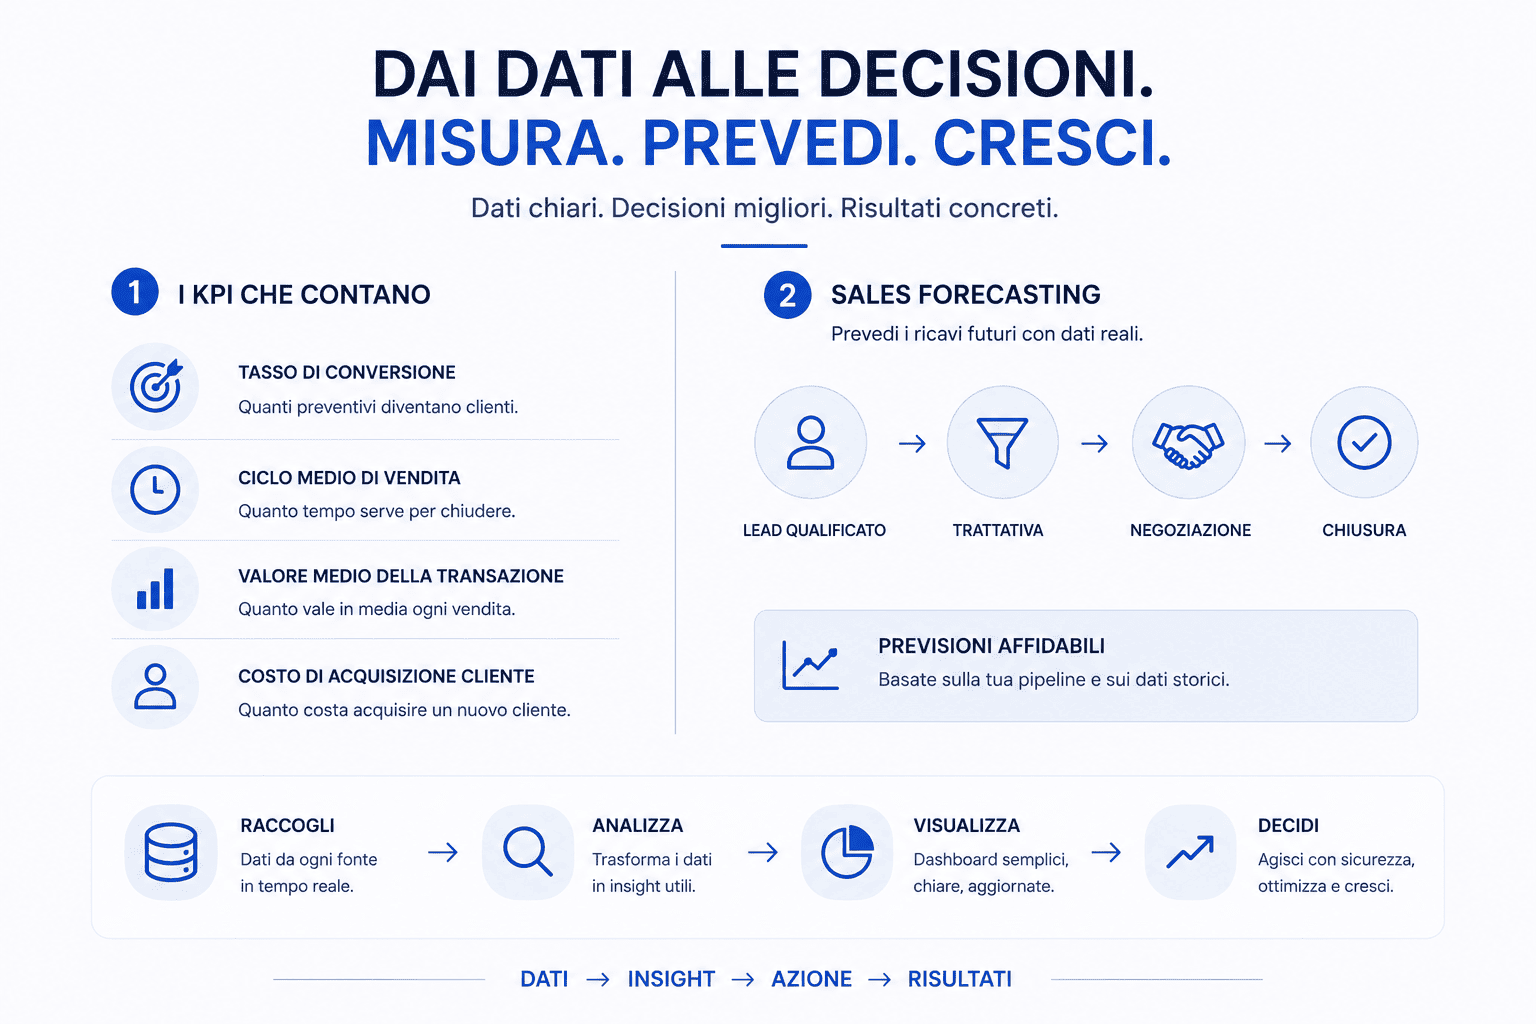
| Conversion rate | Percentage of quotes or deals that become customers | Show commercial effectiveness |
| Win rate | Percentage of negotiations won | Helps understand closing capacity |
| Average sales cycle | Average time from first contact to closing | Measure the speed of the process |
| Average deal value | Average opportunity amount | Helps forecast revenue and priorities |
| Pipeline value | Total value of open deals | Shows future business potential |
| Weighted Forecast | Expected revenue based on probability of closing | Helps predict realistic sales |
| CAC | Customer Acquisition Cost | Measure how much it costs to get a new customer |
| Margin per customer or product | Real profitability | Avoid measuring only turnover |
| Lead response time | Average response time to a contact | It affects the probability of conversion |
| Reasons for loss | Reasons for the unfinished negotiations | Turn mistakes into learning |
These KPIs do not need to live in separate files.
They must be connected to the business process.
Otherwise they remain static numbers.
The useful data is not what is collected.
It's what helps the company take action.
Sales forecasting: predicting sales without relying on hope
Sales forecasting is the process of estimating future sales based on available data.
It's not a crystal ball.
It's a method.
It helps us understand how much the company could sell in the next few months, starting from concrete elements such as:
- open negotiations;
- value of opportunities;
- pipeline stage;
- probability of closure;
- conversion history;
- average sales times;
- seasonality;
- sales performance;
- lead source;
- expected margins.
A simple example.
If the company has open negotiations for €100,000 in an advanced stage and historically closes 60% of opportunities in that stage, the weighted forecast will be approximately €60,000.
It's not a certainty.
But it's much more useful than a "I think we're closing well.".
The value of forecasting lies right here.
It helps turn negotiations into scenarios.
And the scenarios in decisions.
A sales forecast does not have to be optimistic.
It must be useful.
Why sales forecasts help you make better decisions
Sales forecasts serve to give management a clearer vision of the near future.
They help answer crucial questions:
- can we hire a new person?
- can we increase the marketing budget?
- can we buy new equipment?
- can we sustain new fixed costs?
- do we have enough deals to reach the target?
- Which salespeople need support?
- Which offers are at risk of being blocked?
- Which customers should be followed up immediately?
- Which channels are generating real sales?
Without a forecast, the company makes decisions by looking in the rearview mirror.
With the forecast, start looking at the road ahead.
Second Microsoft Dynamics 365 Sales 2026 release wave 1, new AI capabilities work to strengthen the pipeline, enrich data, and help teams prioritize the actions that matter. This points to an important direction: the value lies not just in collecting data, but in transforming it into operational priorities.
And that's exactly what an SME needs.
No more lost data.
But useful signals for deciding.
The problem of fragmented data
Forecasts and KPIs only work if the data is reliable.
But in many companies the data is scattered.
A salesperson updates an Excel file.
Another one uses CRM only halfway.
Marketing keeps campaign data on a separate platform.
The administration manages orders and invoices on a separate management system.
Management receives manual reports once a month.
The result is an incomplete vision.
And a forecast built on incomplete data cannot be reliable.
The problem is not just technological.
It's organizational.
If each department records information differently, the company cannot construct a single reading of reality.
Oracle Fusion Data Intelligence emphasizes the importance of combining trusted data, business semantics, and intelligent workflows to move from insight to action.
This concept is crucial.
Because a dashboard isn't just about showing what happened.
It should help you understand what to do next.
Fragmented data generates fragile reports.
Connected data generates more robust decisions.
CRM as a basis for KPIs, forecasts and dashboards
CRM should not be seen just as a customer archive.
It must become the operational basis for understanding the commercial process.
If configured correctly, the CRM allows you to collect and connect:
- lead;
- sources of acquisition;
- campaigns;
- assigned commercials;
- activities carried out;
- follow up;
- estimates;
- negotiations;
- pipeline stages;
- probability of closure;
- amounts;
- margins;
- results;
- reasons for loss;
- conversion times;
- historical customer.
This data can power dashboards, reports, and forecasts.
This way, the entrepreneur no longer has to reconstruct the numbers by hand.
You can see in real time:
- how is the month going;
- which negotiations are most important;
- what opportunities are stalled;
- which salespeople are performing best;
- which channels bring value;
- what turnover is realistic to expect;
- where conversions are being lost.
CRM isn't just about knowing who your customers are.
It helps us understand where the company is going.
Business Dashboards: See What Matters
An effective dashboard doesn't have to show everything.
It must show what is needed to make decisions.
The dashboard is not an aesthetic dashboard.
It is an instrument of government.
It must be built around business goals.
For example, management might have a dashboard with:
- expected turnover;
- weighted forecast;
- total pipeline;
- negotiations in advanced stages;
- win rate;
- estimated margin;
- critical business activities;
- qualified leads;
- average response times;
- reasons for loss;
- target achieved.
The sales manager may see:
- team performance;
- open offers;
- delayed follow-up;
- negotiations without activity;
- commercial forecast;
- average sales cycle.
Marketing might see:
- channels that generate leads;
- cost per lead;
- qualified leads;
- leads turned into deals;
- campaigns with greater commercial value;
- revenue attributed to activities.
The right dashboard changes based on the role.
But the principle remains the same.
A good report doesn't have to impress.
It must make clear what to do.
Decision Intelligence: From Data to Choice
In 2026, we are no longer just talking about Business Intelligence.
There is more and more talk about decision intelligence.
The difference is important.
Business Intelligence helps you read the data.
Decision intelligence helps connect data, analytics, context, and actions.
Gartner Peer Insights defines decision intelligence platforms as solutions that support, augment, and automate human or machine decisions through data, analytics, knowledge, and AI.
This does not mean that every SME needs to adopt complex platforms.
But it does mean that the direction is clear.
The value is not just in seeing the data.
It's about turning it into a better decision.
For example:
- If the forecast is below target, where should we intervene?
- If the sales cycle lengthens, which phase slows down?
- If CAC increases, which channel is losing efficiency?
- If the win rate drops, what objections are emerging?
- If margins drop, what products or discounts are impacting them?
- If leads increase but sales don't, where does conversion stop?
These are not simple readings.
These are operational decisions.
Data becomes value only when it produces an action.
How to build a data-driven system in your company
Moving to data-driven management doesn’t mean installing software and waiting for results.
We need a method.
1. Define business goals
Goals come before KPIs.
Do you want to increase your turnover?
Improve margins?
Shorten the sales cycle?
Increase your closing rate?
Understanding which channels bring in the best customers?
Better cash flow forecasting?
Each objective requires different data.
2. Choose a few really useful KPIs
Measuring too much can cause confusion.
It's best to start with a few key indicators, linked to the most important decisions.
For example:
- pipeline value;
- weighted forecast;
- win rate;
- average sales cycle;
- estimated margin;
- qualified leads;
- CAC;
- reasons for loss.
3. Centralize information
The data must flow into a single or at least integrated system.
CRM, website, campaigns, quotes, sales, and administration must communicate with each other.
If the data remains fragmented, the reading will also be fragmented.
4. Standardize the commercial phases
To make a forecast, clear phases are needed.
For example:
- new lead;
- qualified;
- first contact;
- quote sent;
- negotiation;
- won;
- lost.
Each phase must have clear criteria.
Otherwise the forecast becomes subjective.
5. Assign realistic probabilities
Each stage of the pipeline can have a probability of closure.
But it must be based on history, not optimism.
If in the past only 30% of the quotes sent have been transformed into contracts, that phase cannot be considered 70% just because “it looks promising”.
6. Create dashboards by role
Management, sales and marketing don't need the same data.
We need to build specific dashboards for those who need to make different decisions.
7. Periodically review forecasts and KPIs
The data should not be looked at once in a while.
It must be monitored continuously.
Every week or month you need to check:
- what has changed;
- what negotiations are advanced;
- what opportunities have been blocked;
- which KPIs are getting worse;
- what decisions need to be made.
Mistakes to avoid
Measure only turnover
Turnover is a bottom line.
But to improve it, we must also observe the steps that generate it.
Leads, deals, conversions, times, margins, and forecasts are key signals.
Trusting only commercial feelings
Seller experience matters.
But the forecast must be based on data, phases, probabilities and history.
Using too many dashboards
Too many dashboards lead to confusion.
It is necessary to show a few truly useful indicators.
Don't update CRM
If the CRM is not updated, the forecast also becomes unreliable.
Data quality is the foundation of decision quality.
Don't connect sales, marketing and administration
Sales don't live alone.
To truly understand the company, you need to connect leads, negotiations, quotes, margins, costs, and turnover.
Confusing reporting and strategy
A report shows a piece of data.
The strategy decides what to do with that data.
Without interpretation, even the best dashboard remains passive.
Checklist: Does your company make data-driven decisions?
| Request | What does it indicate? |
|---|---|
| Can you estimate your turnover for the next 3 months? | There is a forecast system |
| Do you know the real value of your sales pipeline? | The negotiations are traced |
| Do you know which opportunities are most likely to fall through? | The pipeline is readable |
| Do you measure the win rate? | Do you know how much the team can convert? |
| Do you know the average sales cycle? | Do you know how long it takes to close? |
| Do you know which channels generate the best customers? | Marketing and sales are connected |
| Do you know the reasons for lost negotiations? | Mistakes become learning |
| Do you see margins and not just turnover? | Growth is measured by profitability |
| Is the data updated in real time? | Decisions don't depend on old reports |
| Do you have separate dashboards for management, sales, and marketing? | Each role sees what is needed |
If many responses are negative, the problem is not just the lack of reporting.
It's the lack of strategic control.
FAQs on sales forecasting and KPIs
What are sales forecasts?
Sales forecasts are estimates of future revenue based on business data such as open deals, opportunity value, pipeline stage, probability of close, sales history, and average conversion times.
What are business KPIs for?
KPIs are used to measure the health of business processes. They help you understand what's working, what's slowing down, and where to intervene to improve sales, margins, productivity, and conversions.
What business KPIs should an SME monitor?
An SMB should monitor at least pipeline value, weighted forecast, win rate, average sales cycle, average deal value, qualified leads, CAC, estimated margin, and loss reasons.
Why is turnover not enough as an indicator?
Because revenue measures the bottom line, but doesn't explain how it was generated. Without other KPIs, it's impossible to understand whether the company is growing healthily, profitably, and sustainably.
How do you calculate a sales forecast?
A simple method is to multiply the value of open deals by the probability of closing associated with the pipeline stage. For example, €100,000 worth of opportunities with an average probability of 60% generate a weighted forecast of €60,000.
Does CRM help with sales forecasting?
Yes. A well-configured CRM collects data on leads, deals, quotes, activities, pipelines, and sales history. This data allows you to generate forecasts, dashboards, and reports that are useful to management.
How often should KPIs and forecasts be checked?
It depends on the company's pace. Generally, the most important KPIs should be monitored at least monthly, while pipelines, follow-ups, and critical deals can be monitored weekly.
Conclusion
Making data-driven decisions doesn't mean giving up your entrepreneurial intuition.
It means making it stronger.
A savvy entrepreneur sees opportunities, risks, and directions.
But with clear data you can make more confident decisions.
You can figure out where to invest.
Where to slow down.
Where to hire.
Where to correct.
Where to push.
Where to protect the margins.
The future cannot be governed by looking only at the past.
You govern by building a system capable of reading the present and predicting what might happen.
It's not enough to sell.
We need to understand which sales generate real growth.
Want to stop navigating by sight and start making data-driven decisions?
DigiFe Analyze your business processes, identify the most important KPIs for your company, and configure customized CRM dashboards to monitor pipelines, forecasts, conversions, and margins.
This way you can transform scattered data into actionable insights, and actionable insights into faster, clearer, and more growth-oriented decisions.
Make data-driven decisions with DigiFe consulting.