
From 14 October 2020 Google has released the fourth version of a famous and important web traffic analysis tool: Google Analytics 4. Thus was born a platform that manages to satisfy the needs of each individual company to monitor the progress of its site.
In the following lines we will go to see what exactly is Google Analytics, what it does and what has changed compared to previous versions.
What is Google Analytics?
To put it in a nutshell, Google Analytics is a free software capable of collecting and analyzing detailed statistics on visitors to a website and the actions they perform, but also data relating to traffic sources, the device, the operating system and the browser used.
Google Analytics 4 was born as a substitute for Universal Analytics (the previous version of the software) and is based on the app-web beta version of 2019, which was intended to merge the tracking data between web and mobile app, previously managed separately.
It is a radical renewal compared to previous versions and, starting from the name, (almost) everything changes. Google Analytics 4 therefore, it changes skin compared to its predecessor and is now a more difficult tool to use, especially for users with little experience, but more reliable and "intelligent".
How has Google Analytics changed? All the news
The idea behind this new tool is to provide users with the ability to make any web analytic in a personalized way, depending on the model and business objectives of your company.
To do this Google has revolutionized the logic behind the data structure and their management, has changed the graphic interface and has chosen an approach strongly oriented towards machine-learning.
But let's go in order.
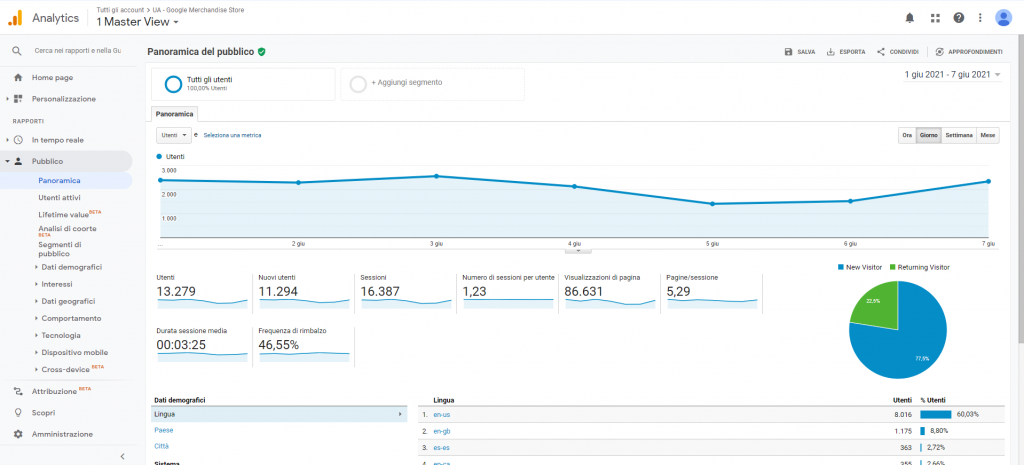
Interface
The first thing you notice when logging in is a simplified interface compared to Universal Analytics. Attention, however, this simplification also derives from the fact that some reports in the UA are no longer shown, making reading the data more difficult and less immediate.
Events
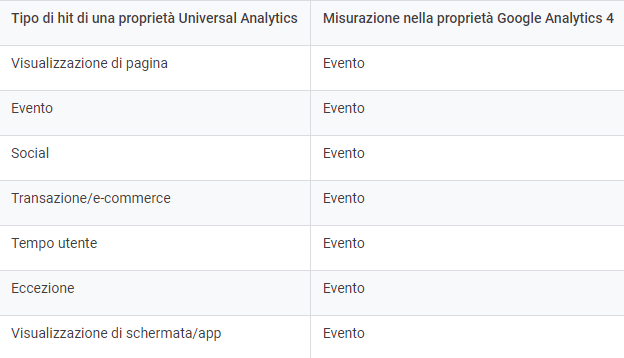
However, the most significant change is the shift from a model based on the concept of session (hit) to one based on the concept of event. In fact, if previously UA monitored the user's interactions with a site in a given period, Analytics 4 turns every interaction into a event. Clicking a link, downloading a document, playing a video, are just some examples of events that Google Analytics allows you to analyze.
To better understand these changes, this table shows the differences between UA and GA4:
The events of Google Analytics 4 they are divided into 4 types:
- the automatically collected events, events collected automatically by GA4 such as the start of the session, the language and the place from which the user connects to the network;
- the enhanced measurment events, measurement events that need to be configured and activated. They are essential for keeping track of key events and can be customized according to the business model. Among the main examples we find download, searches, pageview is scroll;
- the recommended events, events that need to be triggered and that Google recommend for a more accurate analysis. These include logins, shares and purchases;
- the custom events, events to be implemented but without predefined parameters and, therefore, completely at the discretion of the web analyst.
We will come back to talk about it later in more detail.
Involvement
Each user interaction is therefore interpreted as an event in itself, which can involve different platforms and devices. Consequently the infamous Bounce Rate (bounce rate) is eliminated in favor of a new concept: theEngaged Session (involvement).
The Bounce Rate it indicated the percentage of sessions, for a single page, in which there was no interaction with the page itself. This parameter, in practice, showed how many users, after having opened a particular page, left it without performing other actions. L'Engaged Sessioninstead, it keeps track of all sessions with a duration greater than 10 seconds or with a number of pageviews of 2 or more pages.
This change allows for a more precise analysis since, as has often been said, the Bounce Rate was a deceptive parameter: it is in fact possible that a user effects a visit to a page, finds what he was looking for, but "bounces" off it anyway. (just think of a news page that, once read, does not present other possible interactions).
On the other hand, the new model based onEngaged Session it is more flexible and provides a wide variety of useful information to monitor the user experience on your site.
Machine-learning
Recent restrictions on privacy and data processing have made it more difficult for AI (Artificial Intelligence) to track data. To overcome this problem Google has implemented the system of machine-learning, in order to provide insight (knowledge) predictive on web user trends.
Data Stream
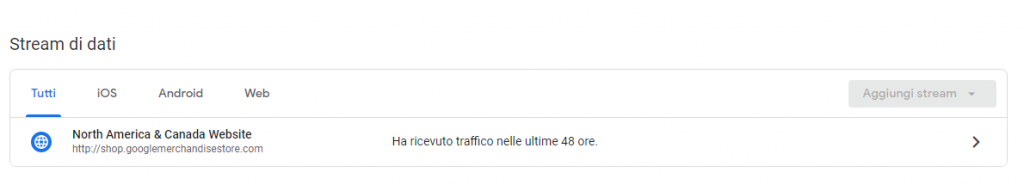
Another parameter that is eliminated is the one related to the views, in its place the Data Stream. It allows you to manage data from multiple sources (web, app) and, thanks to data filter, allows an in-depth analysis of the latter.
Upgrades and additions
Finally, the latest news concern the enhancement of some tools and integration with other software. Among the instruments that have undergone an upgrade we find the cross-domain, the monitoring tools for eCommerce and the DebugView.
Among the software that have undergone an enhanced integration, however, Google ADS stands out. By linking the account of Google ADS to Analyticsin fact, it is possible to monitor user behavior towards your advertising campaign.
For more information in this regard, refer to the appropriate section of the Analytics guide.
How to use Google Analytics 4
Once the novelties and differences with the previous versions have been clarified, let's now see, in practice, how to use Google Analytics 4.
The first step is to create a property Analytics for each site you want to monitor in the section Administration.
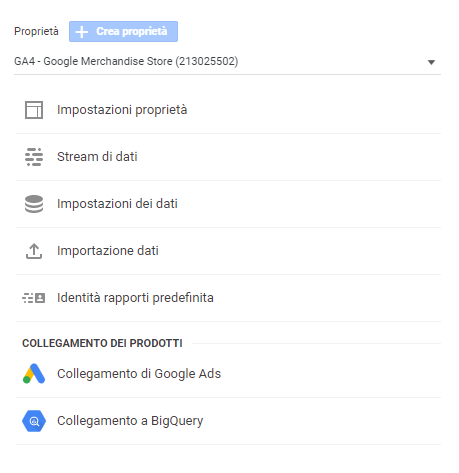
After clicking on Create properties, you will be asked for some information such as the site name, time zone, currency and URL. Enter the required data and confirm by selecting the item Create.
Done that Google Analytics will automatically generate a tracking code that must be entered in the head of each page of your site and that you can find in the section Tracking code, shown in the picture.
This operation allows you to connect Google Analytics to the site to be monitored and can be done in three ways:
- manually, through a simple copy / paste of the snippet inside the of each page (yes exactly all of them, one by one);
- through Google Tag Manager, another interesting tool that will be the subject of future discussions;
- through the use of a plugin, if your site was built with a CMS.
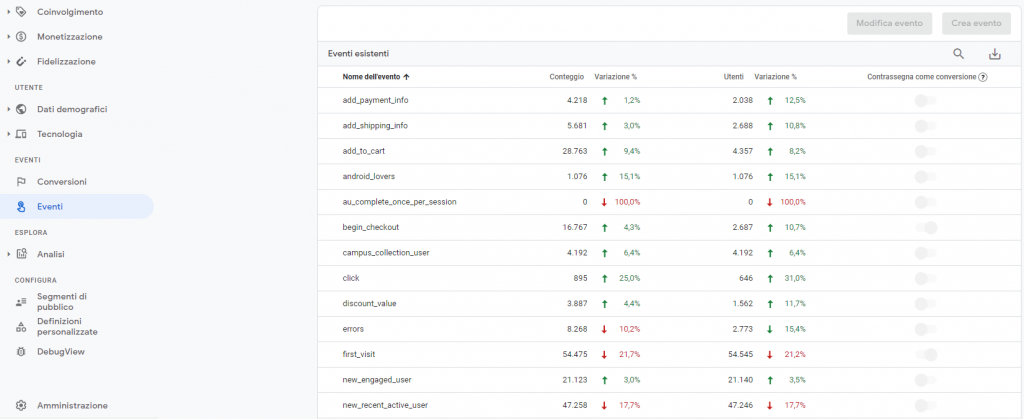
At this point you can start tracking events, always taking into account the fact that GA4, by default, it collects various events that can be consulted in the appropriate section of the Analytics guide.
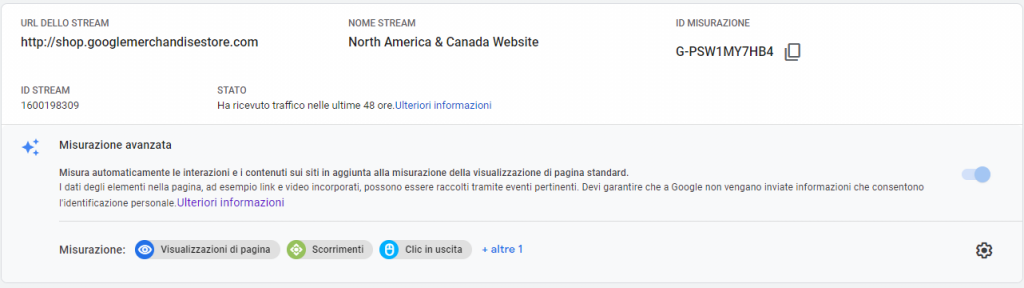
In the section Advanced measurement (Administration> Data Stream> Advanced Measurement) You can also measure user interactions via some easy options provided by GA4, without having to change the code. Events tracked by default include page views, scrolls, outbound clicks and site search, but can be changed via settings (the gear symbol on the right).
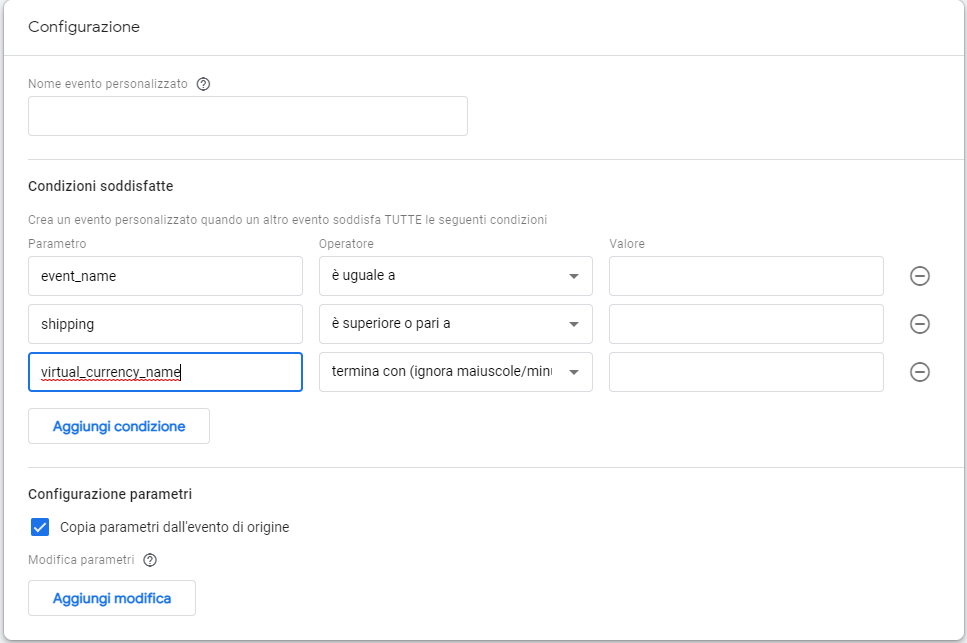
If the events you are interested in monitoring are not present in any of the sections just described, Google Analytics allows you to create custom events.
Click on Events> Create Event to start. First of all it is important to choose the first name that you decide to give to the event: it is a good rule that the name is as identifying and unique as possible, in order to avoid confusion and be easily traceable.
If you intend to monitor the files downloaded by users of your site, for example, the event will be named Downloads or something very similar. Google also places a limit of 500 names for each GA4 property, so be careful not to overdo it by creating too many event names.
You will then be prompted to enter i parameters that govern your event, i.e. what you want to monitor about your event. In the case of an event login, for example, it might be useful to use method, so as to receive information on which methods are used to access your site (eg: via email, through facebook, with username and password).
Finally you need to set up a trigger or, in other words, the action that generates the event. To take up the example of the login previous, the event comes triggered when a user logs in with credentials to your site.
Of course, manually entering all this information can be a long and tedious job, especially with a large number of pages, sites or properties to manage. The solution comes from a tool, already mentioned above, which will be the subject of future discussions: Google Tag Manager.
Conclusions
Nowadays, in the world of marketing, data analysis is becoming more and more important and the analysis tools are becoming more complex and difficult to use but, at the same time, more precise and reliable.
The advent of Google Analytics 4 it is, in this sense, an example of this trend since it represents the future (at least near) in the field web analytic and, in all likelihood, lays the foundations for the analysis models to come.